How the Iran war shock is transmitting through energy into the front end and what decides whether we get a flattener or a steepener….
The rates market is being forced to price something it hates… An inflation impulse that shows up alongside a growth shock and a volatility shock, all at once.
Over the last few sessions, the U.S.-Israeli conflict with Iran has shifted from headline risk to physical disruption risk. And once you’re in physical-risk territory, the Strait of Hormuz becomes the macro variable that matters. It’s the chokepoint where roughly a fifth of global oil consumption and a meaningful share of LNG typically transits. If that pipe gets kinked, even partially, you don’t need a full shutdown to get a non-linear response in delivered prices.
That’s what the market is reacting to now. Shipping through the strait has slowed to a near halt, and freight and insurance are behaving as if the system is trying to ration barrels, not just reprice them.
Oil is responding accordingly. Brent has been trading in the low-to-mid $80s, briefly printing the mid-$80s earlier today, and it’s up mid-teens in percentage terms since the conflict intensified. Refined products have moved even more violently and that’s the part of the complex that matters most for near-term CPI and for consumer psychology.
This is also why rates aren’t giving us a clean risk-off rally. In the first hours you get the classic safe-haven bid… and then inflation fear grabs the tape back. On March 2, yields rose across the curve as flight-to-quality faded and inflation risk took over… 10s were up roughly ~8bp and 2s up ~10bp on the day.
What I want in this note is a simple framework I can keep coming back to a way to translate war to energy to rates without overfitting every headline. Specifically, why the short end becomes the battlefield, why energy = steeper curves eventually is sometimes right (and sometimes wrong), and what I can actually watch to know which regime we’re in.
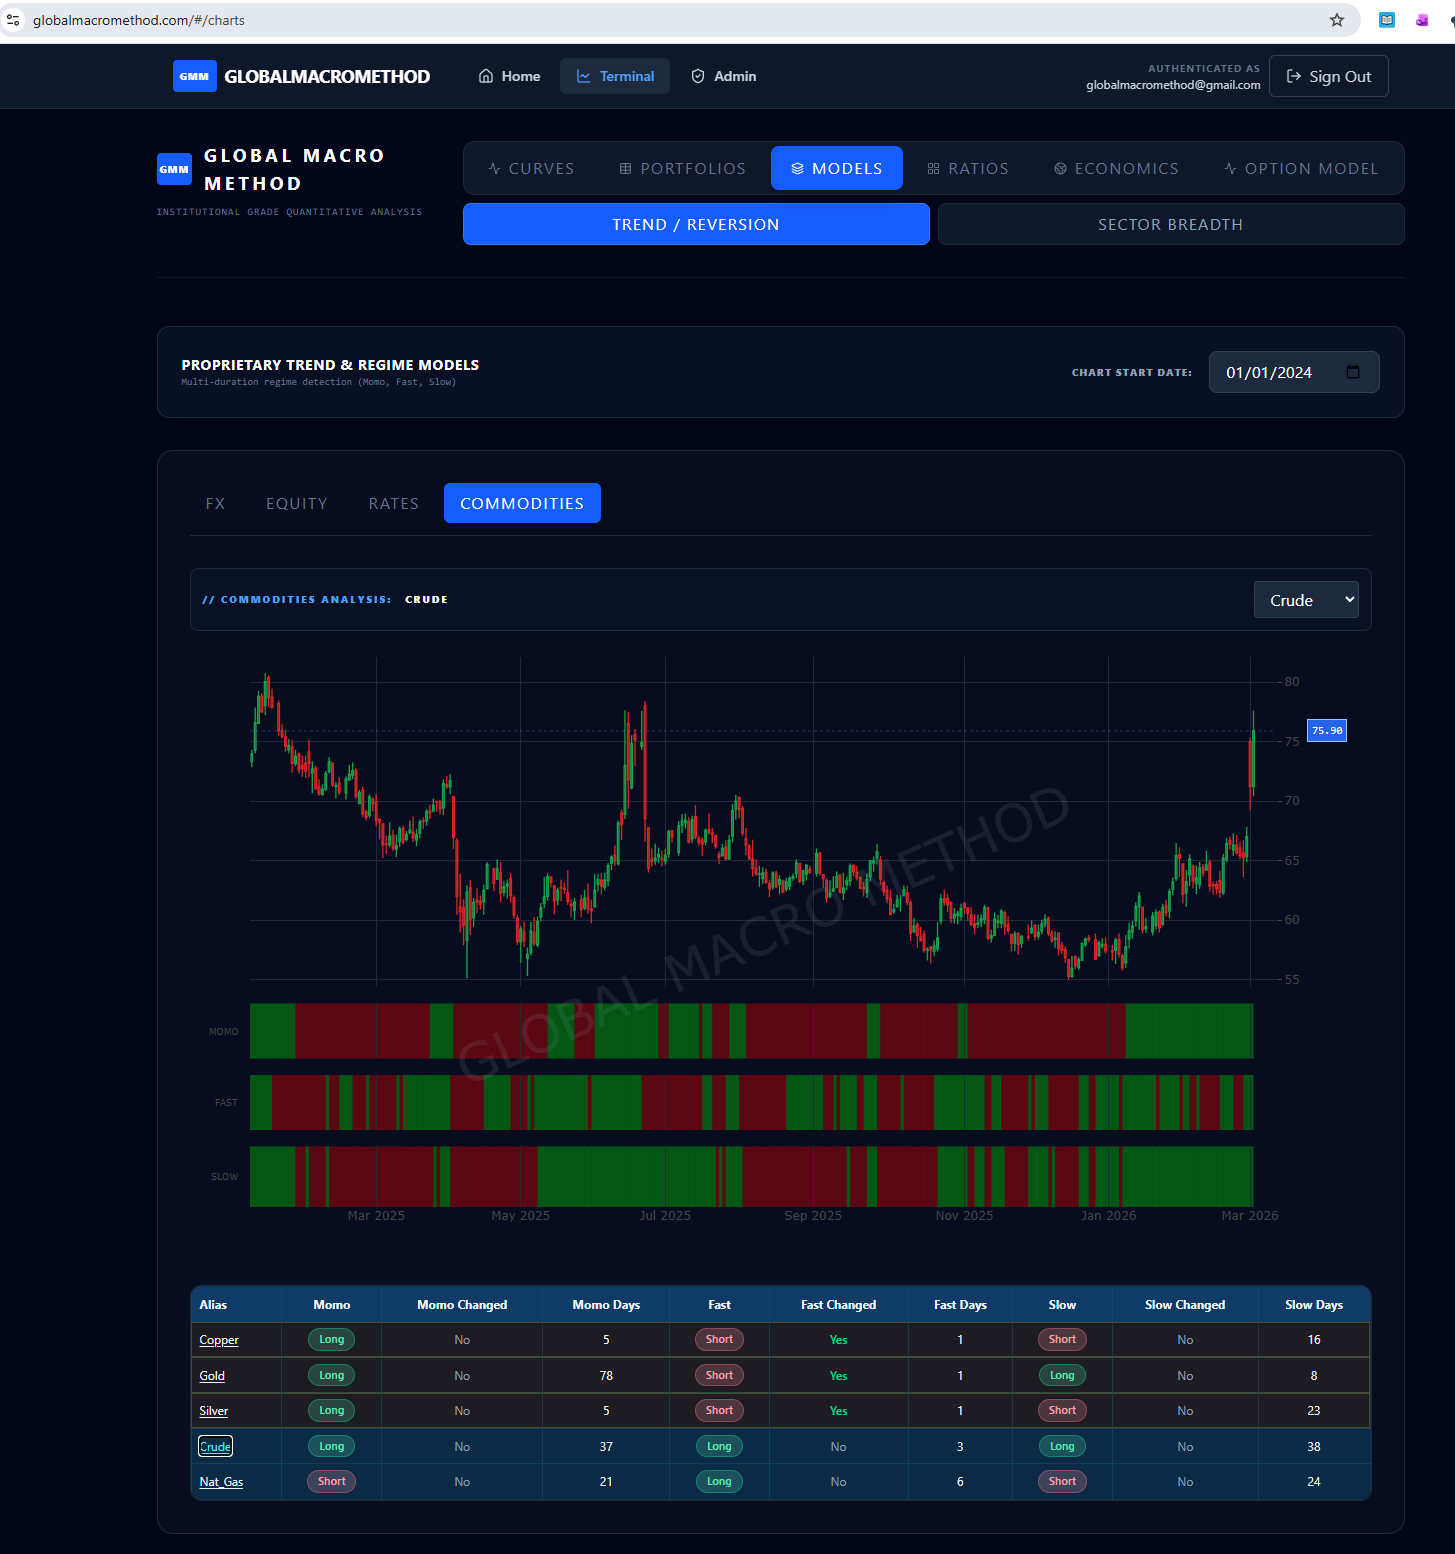
The website www.globalmacromethod.com is live and has regular updates, below is the view for the trend/reversion model. with screening for new signals along with interactive charts