By now we’ve moved a long way from staring at a single index chart.
In Part I (link), we started with Cyclicals vs Defensives – a clean, forward-looking read on whether the equity market is quietly upgrading or downgrading its growth expectations.
In Part II (link), we added Value vs Growth and High Beta vs Low Vol. That gave us a proper three-dimensional view:
Cyclicals vs Defensives – growth up or down?
Value vs Growth – what kind of rates and inflation regime sits underneath?
High Beta vs Low Vol – how much risk the market actually wants to run, and what sort of volatility it’s braced for.
Taken together, those three ratios already start to behave like a mosaic rather than three random lines.
In this instalment, we move one step closer to the real economy and the weakest balance sheets. We’re going to add three more lenses:
Small Caps vs Large Caps (RTY/SPX) – domestic demand and credit conditions.
Transports vs Industrials (IYT/XLI) – “stuff movers” vs “stuff makers”.
Purchasing Managers’ Equity Basket (UP.., FD.., CA.… and others) – orders, shipments, inventory, and capex in equity form.
These are the places where “micro drives macro” shows up first. They feel changes in lending, freight, and purchasing decisions before the top-down data catches up – and they translate cleanly into trades in curves, STIR, and credit.
For readers who join on the Annual plan, I’ll also be sharing a set of trading templates and Trading View scripts (including the underlying code for python application).
For those on the Annual Plus plan, you’ll have the additional option of direct calls and guided support as you build and refine your process. This tier is capped at 10 people so I can commit meaningful time to each person.

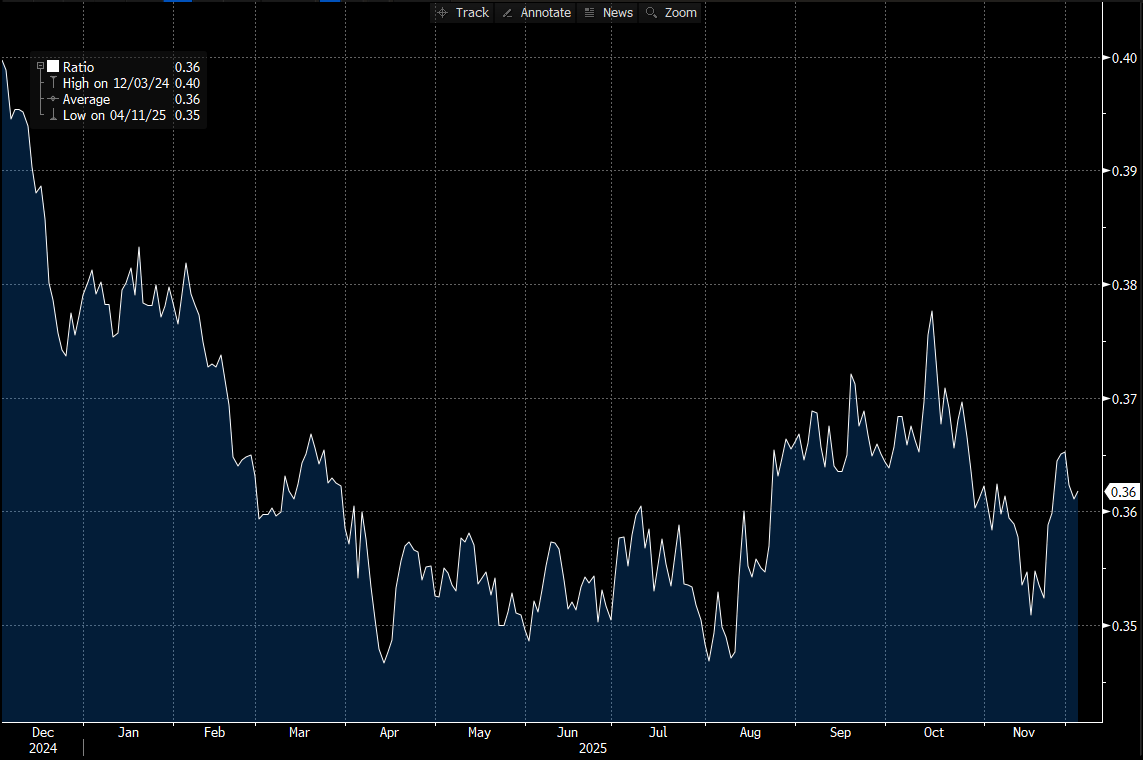
Small Caps vs Large Caps (RTY/SPX): Domestic Demand and Funding Stress
This ratio is your equity-market read on domestic demand and, crucially, the credit conditions facing weaker balance sheets.