

The Curve as a Regime Engine
If Part I is the discipline of asking the right first question, is the market rewarding risk, or paying for protection? Then Part II is the discipline of not stopping there.
Because risk-on/risk-off is not the full regime. It’s the most simplistic regime.
Underneath sits the function that decides what kind of risk-on you’re actually dealing with, and how long it will last: the rates curve.
Equities can be up while the curve is quietly repricing the cost of time, leverage, and uncertainty. You can have the right narrative and still bleed because the curve is telling you something your setups don’t yet reflect: carry is getting more expensive, duration is becoming fragile, policy is becoming binding, or the market is buying insurance.
This is why the curve is not a “rates view” add-on. It’s a framework tool. It tells you what force is governing the system right now and, more importantly, it can inform you what the next force is likely to be.
The aim in this part is not to turn you into a bond strategist. It’s to give you a repeatable way to translate curve behaviour into three things you can actually trade:
what regime you’re in today,
what the market is pricing as the constraint, and
what the plausible next state is if that constraint tightens or relaxes.

Lock in, shits about to get real!
The core idea: the curve is a state machine, not neccessarily a chart
Most traders look at the curve like it’s a picture of “rates up” or “rates down.”
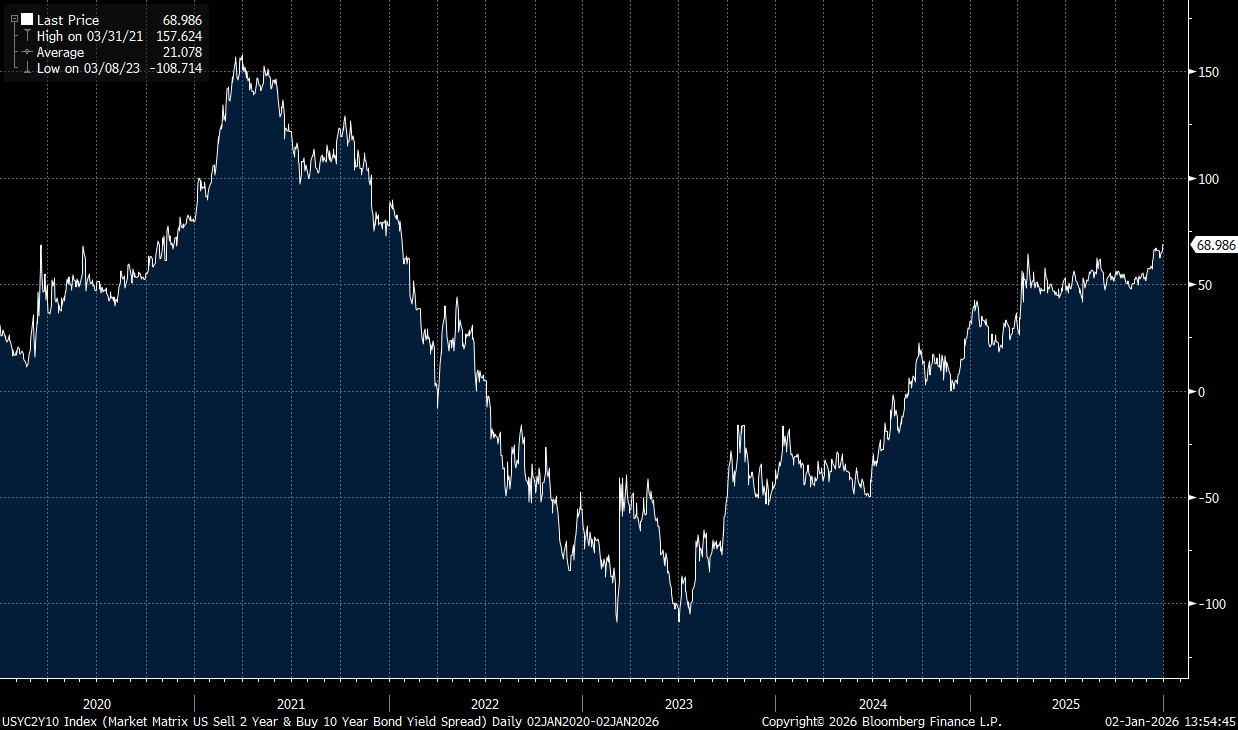
That misses the point.
The curve is a system map. It compresses the market’s view of policy, growth, inflation uncertainty, and risk appetite into a shape. And that shape tends to move through a limited set of regimes.
