

In financial markets, central bank expectations significantly influence pricing across various parts of the yield curve. While the short-end of the curve is often driven by central bank policy decisions, the long-end reflects investor expectations about future economic conditions, inflation, and the broader macroeconomic environment. This post explores how central bank policy expectations interact with short-term interest rates (STIR) and extend across to the 30-year bond, with a focus on current US market pricing.
1. The US Yield Curve and Its Parts
The yield curve represents the relationship between the interest rates (or yields) of government bonds and their maturities. The curve typically has three main segments:
Short-end (STIR): This part covers overnight to 2-year maturities, heavily influenced by central bank policy, including the Federal Reserve’s (Fed) interest rate decisions and market expectations around monetary policy.
Intermediate (2-year to 10-year): These maturities reflect market expectations of future economic conditions, inflation, and monetary policy actions in the medium term.
Long-end (10-year to 30-year): The long end of the curve is driven by long-term inflation expectations, economic growth forecasts, and the supply-demand dynamics of government debt.
2. The Short-End of the Curve: Central Bank Expectations in Action
The short end of the yield curve is directly impacted by central bank expectations. The Federal Reserve sets short-term rates through its policy decisions, often targeting overnight borrowing rates (the federal funds rate). These decisions shape the 2-year Treasury yield and influence the pricing of STIR futures.
Market participants price in the probability of future rate hikes or cuts by interpreting central bank guidance, economic data, and inflation indicators. Currently, market expectations for the Fed’s actions are influenced by factors such as:
Inflation trends: Higher-than-expected inflation may lead the Fed to maintain or raise short-term rates.
Economic growth: Slower growth or recession fears might prompt rate cuts.
Labor market conditions: A tight labor market could signal persistent inflation, keeping rates higher for longer.
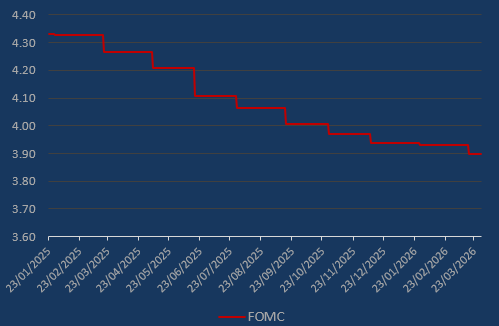
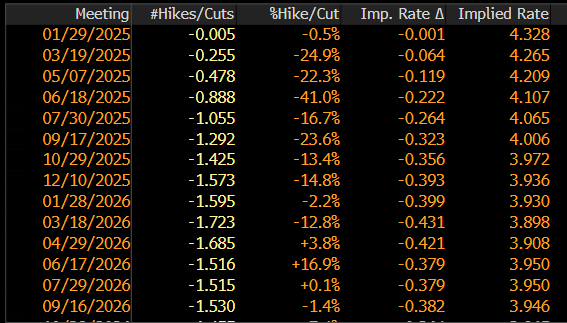
Current Market Example: Currently markets are pricing in a Fed funds rate that is expected to stay relatively high due to persistent inflation pressures amind robust growth and resilient labor market. This can be seen in the pricing of short-term Treasuries and Fed Funds futures, which reflect expectations of rates remaining at current or slightly elevated levels.
3. The Intermediate Part of the Curve: Where the Market Adjusts to Expectations
The 2-year to 10-year section of the curve is influenced by how investors perceive the Fed’s actions will play out over the next few years. Market pricing here reflects expectations of the terminal rate (the peak of interest rates) and how long the Fed will maintain high rates before easing.
As the Fed raises short-term rates, the intermediate part of the curve typically moves higher. However, if investors believe the economy will slow significantly in the near future, the 10-year yield might decline, even as the 2-year yield rises. This leads to an inversion of the yield curve, a common signal of recession.
Current Market Example: At present the ‘belly’ of the curve has shown a decline from its recent highs, suggesting that investors expect the Fed to continue some easing rates in 2025, despite the inflationary pressures and strong economy. The market is positioning for a slowdown in growth, leading to expectations of lower rates in the intermediate term.

4. The Long-End of the Curve: Inflation and Growth Expectations
The 10-year and 30-year portions of the yield curve are more sensitive to long-term growth and inflation expectations. These yields are less influenced by immediate central bank actions and more by broader macroeconomic factors, such as:
Long-term inflation expectations: If inflation is expected to stay elevated in the long term, the long-end of the curve will remain elevated as well.
Economic growth prospects: Strong long-term growth leads to higher yields at the long end, as investors demand more return to hold bonds over a longer horizon.
Government debt and fiscal policy: The issuance of long-dated government bonds can also influence the long-end of the curve.
Current Market Example: Despite the Fed’s initial dovish stance when it kicked off the cutting cycle and more recently introducing a hawkish tone. The 30-year Treasury yield has remained relatively stable, signaling that markets are still uncertain about long-term inflation pressures, growth prospects and arguably the most important part the fiscal backdrop given the expected policy from a 2nd Trump administration.
5. Linking Central Bank Expectations to Yield Curve Pricing
At any given time, central bank expectations on short-term rates are baked into the pricing of STIR and the 2-year Treasury. The 5-year to 10-year portion reflects how the market interprets those actions in the context of future growth and inflation, while the 30-year yield encompasses the market’s views on long-term economic conditions (inc fiscle policy).
Classically when central banks hike rates, the short and intermediate parts of the curve typically move higher. However, once inflation is brought under control, the market shifts its focus toward long-term growth, which will determine the shape of the long end of the curve.
6. Conclusion: The Dynamic Nature of the Yield Curve
The relationship between central bank expectations and the US yield curve is complex, with each part of the curve reflecting different time horizons and market perceptions. By understanding the interplay between short-term rates, intermediate expectations, and long-term growth prospects, traders and investors can better anticipate market movements and make more informed decisions.
7. Note:
More trades will come this week as we reposition the book for left and right tails.
Till next time….. "That's a nice haircut. Did you do it yourself?"
