So for a long form article that will focus on the US, I want to set the scene
"If we're right, people lose homes. People lose jobs. People lose retirement savings, people lose pensions. You know what I hate about f*cking banking? It reduces people to numbers…"
The U.S. economy, beneath its surface resilience, feels eerily close to a tipping point, and the data backs up that gut feeling.
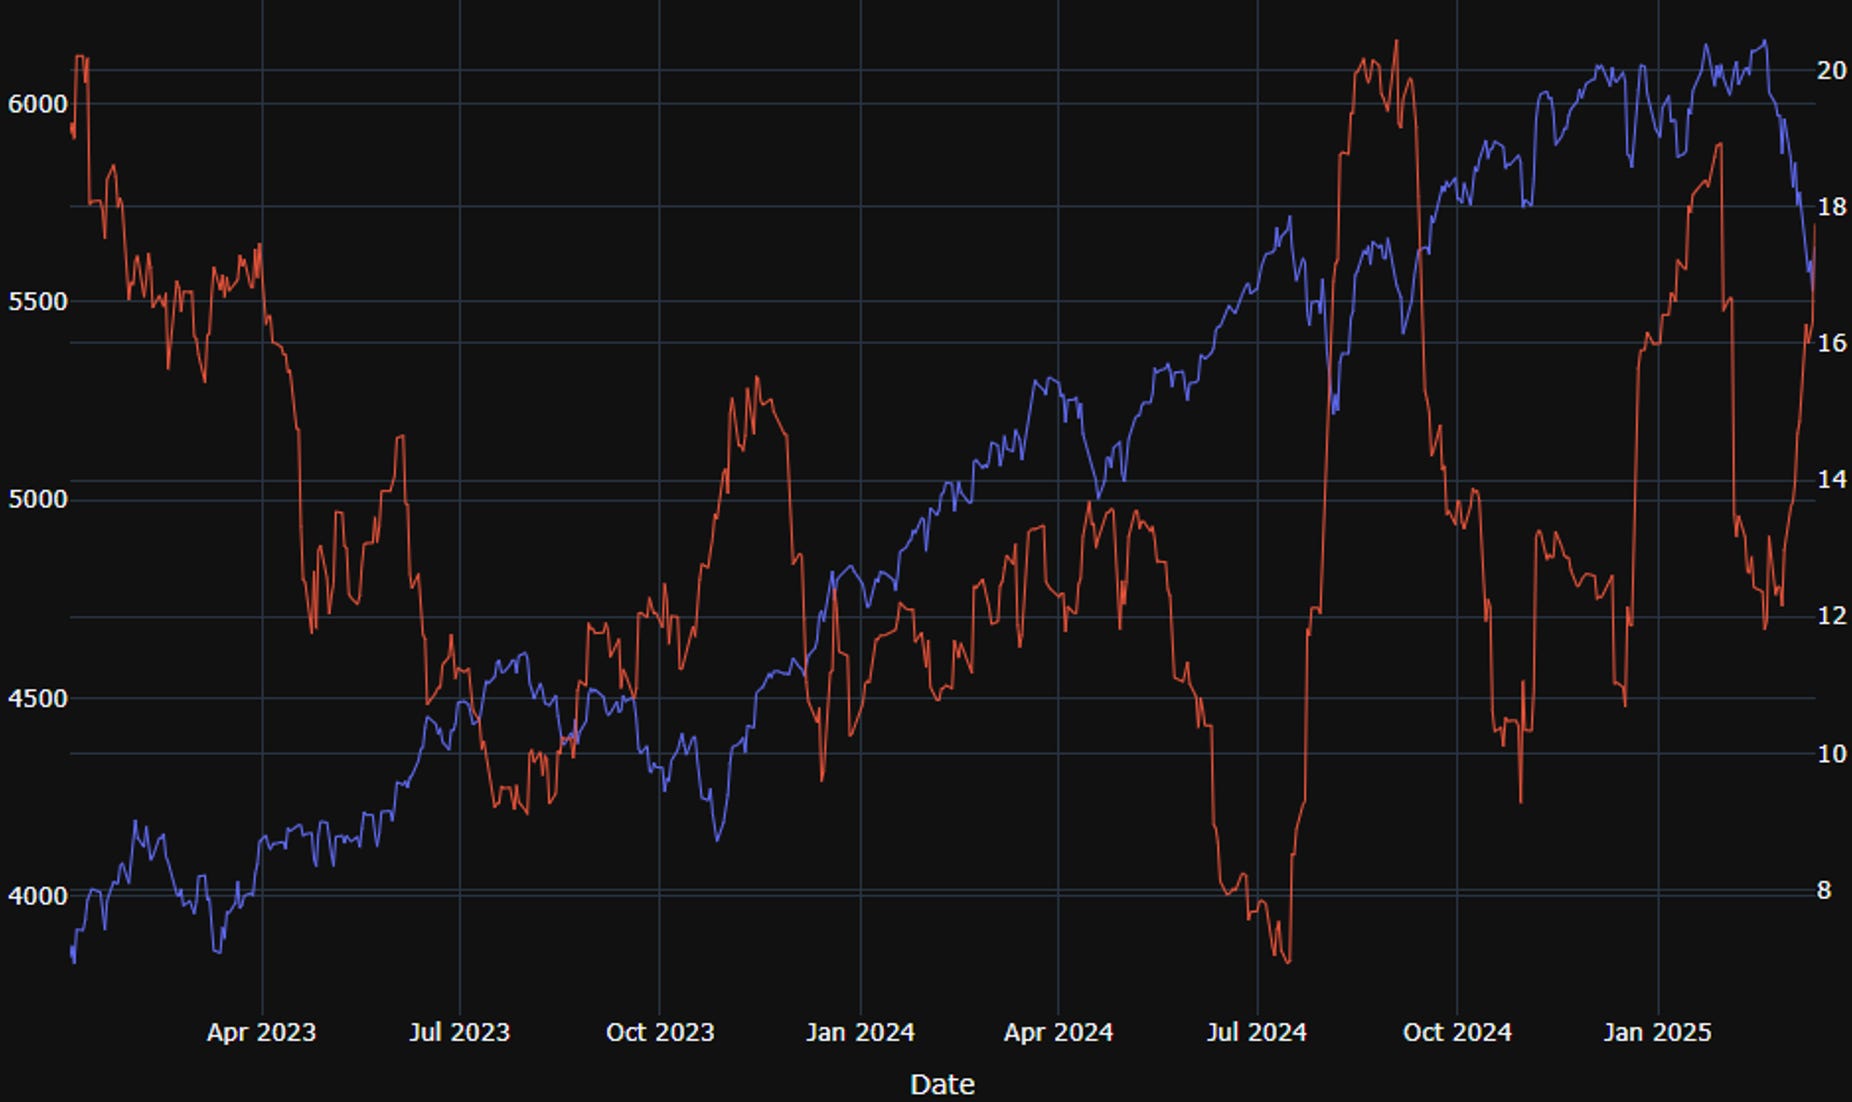
The charts that follow aim to put this into perspective tracing how far we’ve traveled and offering a lens on just how quickly things can shift. They’re not mere illustrations; they’re snapshots of a market wrestling with uncertainty and opportunity.
First up is the S&P 500 alongside its 30-day realized volatility. I’m not sold on us hitting a solid bottom yet. The market’s primed to "buy the dip" a knee-jerk reaction fueled by years of conditioned optimism. Flip to the second chart, and the drawdown tells a similar story: we’re at a depth where traders and punters spy a risk-reward setup ripe for a short-term bounce. But is this a genuine floor or just a pause before the next drop? Let’s unpack the numbers.