

One of the laziest phrases in macro commentary is also one of the most common.
“The market is pricing 75 basis points of cuts.”
You hear it constantly. It sounds neat, it sounds informed, and it gives the impression that something precise has just been said. But most of the time it is doing far less work than people think. It gives you a number, but not much of the structure underneath it. It tells you something about where expectations sit, but not much about how that pricing is distributed, what kind of macro shock is driving it, or how much conviction the market really has behind the path.
And to be blunt, this is exactly where a lot of commentary on the SOFR curve falls apart.
There is no shortage of Substacks, Twitter threads, and market notes willing to tell you that the curve is pricing this many cuts or that many hikes. But a surprising amount of that commentary is really just reading a simplified cartoon of the front end. It is not reading the actual contracts with any real understanding of the mechanics embedded within them. People talk confidently about the curve while having only a very loose grasp of the basis inside it, the IMM structure that defines the contracts, or what a contract like December 2026 is actually pricing.
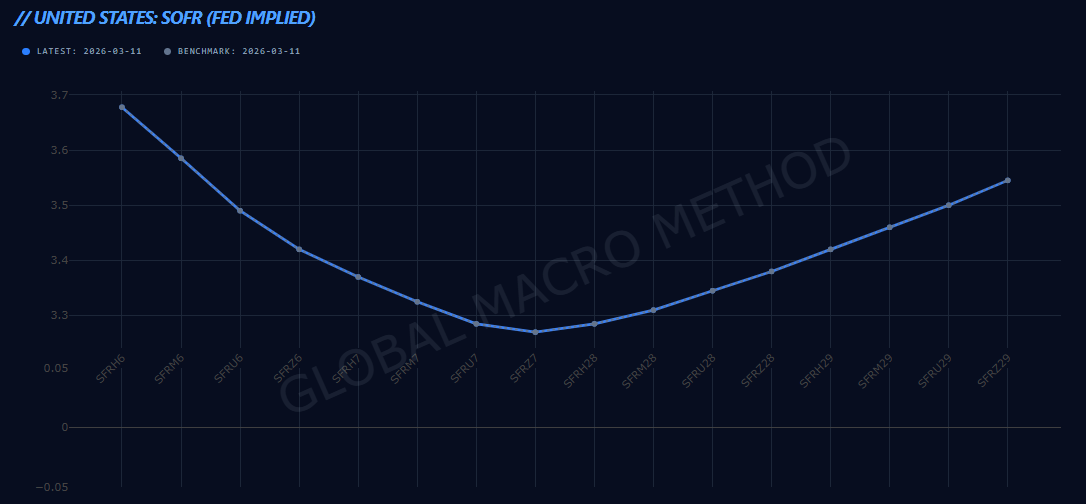
That matters more than most people realise. Because once you strip away the jargon, the front end is one of the cleanest places in all of markets to observe macro uncertainty being translated into price in real time. If you read it properly, it gives you a live signal on how traders are thinking about inflation, growth, labour market resilience, central bank behaviour, and policy timing. If you read it badly, it becomes little more than a headline scoreboard with a few basis points attached to it.
A lot of the sloppiness comes from the fact that many people commenting on these markets have never had to actually sit on a desk and live inside the instruments they are talking about, whether on the sell side or the buy side. They have never had to price them, hedge them, risk-manage them, or explain the difference between a contract rate, an expected policy rate, and the path that links the two. So they end up talking about the front end as if it were just a clean string of central bank guesses laid out in quarterly form. It is not.
That is why I want to start with the basics properly.
When people refer to “the front end,” they are talking about the part of the rates curve that is most directly anchored to expected central bank policy over the near-term horizon. In practice, that means short-dated rates instruments and pricing structures that are heavily influenced by what the policy rate is expected to do over the next several meetings, rather than by long-run growth assumptions, term premium, or structural inflation risk further out the curve.
That is also why the front end matters so much. It is the part of the market where macro narrative meets policy expectation most directly. If the market thinks inflation is proving sticky, the front end usually feels that quickly. If the market thinks labour is rolling over and the central bank will soon need to respond, the front end usually tells you before the broader curve has fully settled on what that means. If the market begins to lose confidence in the reaction function altogether, again, the front end is usually one of the first places you will see it.
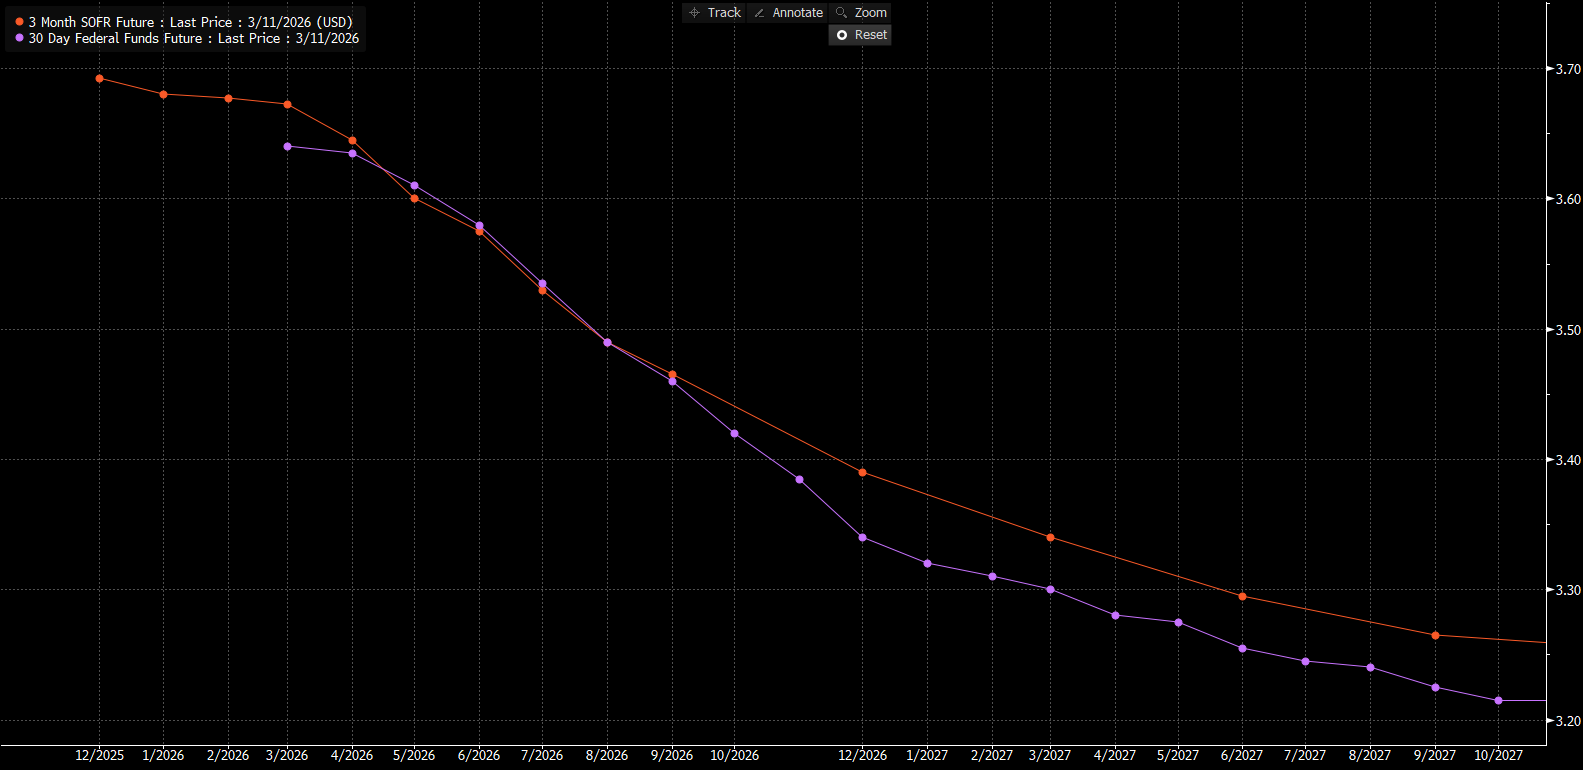
So yes, when people say the market is “pricing cuts,” they are not entirely wrong. But they are compressing a much more complicated object into a very blunt phrase.
To see why, think about what they are actually trying to describe. If the market is pricing 75 basis points of cuts by year-end, that could mean several quite different things. It could mean the market expects a steady and orderly easing cycle to begin in a few meetings’ time. It could mean the market expects nothing for a while, then a rush of cuts later as growth finally cracks. It could mean inflation is still too uncomfortable near term, but further out the market thinks that same inflation pressure will eventually damage activity enough to force easing. It could even mean the market is carrying a large amount of uncertainty premium and is pricing a distribution of outcomes rather than one neat central scenario.
Same headline number. Very different macro messages.
And this is where understanding the contract structure stops being a technical footnote and starts becoming essential.
Take quarterly SOFR futures. Many people speak about them as if each contract were simply a clean bet on where the Fed will have rates at the end of that quarter, or worse, on some calendar date that sounds roughly close enough. That is not how it works. These contracts sit on IMM dates, and the underlying reference period is tied to that structure, not to whatever convenient mental shortcut makes the chart easier to narrate. A December 2026 quarterly SOFR contract is not a tidy vote on where the policy rate sits on 31 December 2026. It is tied to the reference quarter running from the December 2026 IMM date to the March 2027 IMM date, and it settles on a compounded average of daily SOFR over that window.
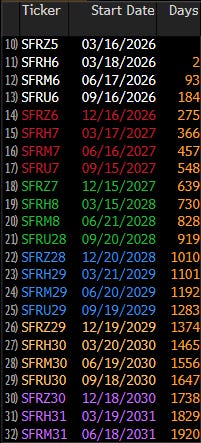
That is a very different thing.
So when someone looks at a December 2026 contract and casually says, “the market is pricing the Fed here by the end of 2026,” there is already slippage in the interpretation. The contract is not pricing a single spot rate at year-end. It is pricing an average overnight funding rate across an IMM-defined accrual window that extends into the following quarter. Once you understand that, you immediately see why translating the strip into a clean meeting-by-meeting policy path requires more care than most market commentary gives it.
There is basis embedded all the way through that exercise. There is the basis between SOFR and the policy rate people think they are talking about. There is the basis between futures pricing and OIS-style path interpretation. There is the basis created by the averaging window itself. And there is the timing basis that appears because FOMC meetings do not line up perfectly with the quarterly contract structure people like to use when telling simplified stories about the curve.
In calm markets, some of that can look small enough that people get away with hand-waving it. In more volatile or event-heavy periods, it matters a lot more. Either way, if you are serious about reading the front end properly, you cannot just wave it away because it complicates the narrative.
That is the first real shift in thinking I want readers to make. The front end is not just telling you how much easing or tightening is priced. It is telling you something about the shape of the path, the timing of the path, and the market’s confidence in how that path is likely to unfold. And because the contracts themselves have structure, basis, and timing conventions embedded in them, you need to understand that machinery before you can interpret the message with any real confidence.
Timing, in particular, matters far more than casual commentary usually suggests.
A market pricing 75 basis points of cuts over the next twelve months is not saying the same thing as a market pricing 75 basis points of cuts concentrated into the next three meetings. In the first case, the message may be that inflation is gradually coming under control and policy can ease in measured fashion. In the second, the message may be that something is breaking and the central bank will need to move abruptly. Those are not minor differences in tone. They are entirely different macro regimes.
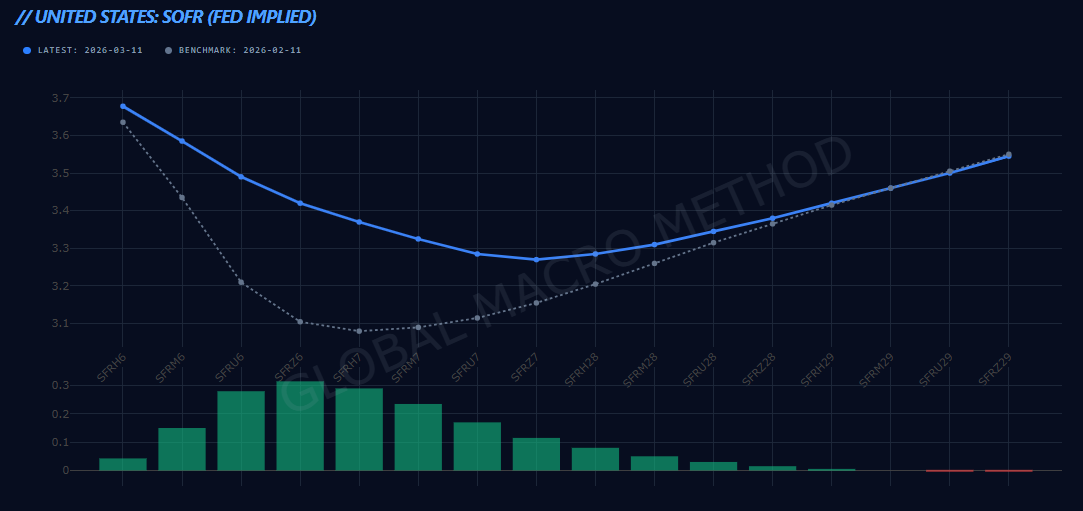
This is where many readers get tripped up, because they treat front-end pricing as if it were a single-point forecast. They want the market to be giving them a clean answer: this is where rates are going, and this is what the central bank will do. But that is not really how market pricing works. Front-end pricing is a market-clearing expression of probabilities, hedging demand, macro conviction, and uncertainty. It reflects the weighted average of what participants believe could happen, not a tidy declaration of what will happen.
That distinction sounds technical, but it is incredibly important.
If you think of the front end as a forecast, you will constantly misread the signal. You will be tempted to say things like, “the market was wrong,” when in reality the market may simply have been pricing a plausible distribution of risks that did not end up materialising. Or you will look at one day’s repricing and assume the macro narrative has decisively changed, when sometimes all that has changed is the balance of probabilities between two nearby paths.
A much better way to think about it is this: the front end is the market’s live price for the central bank reaction function under current information. That is more cumbersome, admittedly, and it will not get you quoted on television quite as often, but it is much closer to the truth.
Once you frame it that way, a lot of things become clearer.
You stop asking only, “How many cuts are priced?” and start asking more useful questions. How quickly are they priced? Are they front-loaded or back-loaded? Has the market shifted the timing of the first move, or has it changed the expected depth of the whole cycle? Is the pricing consistent with a benign disinflation process, or does it look more like delayed easing under inflation pressure? Is the market moving because the data are changing, because commodities are moving, because policy rhetoric has shifted, or because uncertainty has simply risen?
Those are the questions that move you from spectator to practitioner.
It is also worth stressing that the front end does not exist in a vacuum. Even in this first, more mechanical installment, it is important to understand that front-end pricing is never just a pure read on central bank intention. It is shaped by a wider mix of forces: inflation expectations, labour market resilience, growth momentum, policy credibility, supply shocks, geopolitical stress, and simple positioning dynamics. In calm periods, those forces may line up neatly enough that the pricing story looks clean. In messier periods, they do not. That is precisely why the front end is useful, but also why it must be interpreted rather than merely observed.
Take a simple example. Imagine the market prices fewer cuts than it did a week ago. On the surface, that sounds hawkish, and plenty of commentary stops there. But fewer cuts can be priced for very different reasons. It may be that the economy looks stronger and the central bank does not need to ease. It may be that inflation has re-accelerated and the central bank is constrained from easing even if growth is softening. It may be that one ugly inflation print has forced near-term cuts out of the path even while the medium-term growth picture remains fragile. Those are different signals. A change in the front end is only the beginning of the analysis, not the end of it.
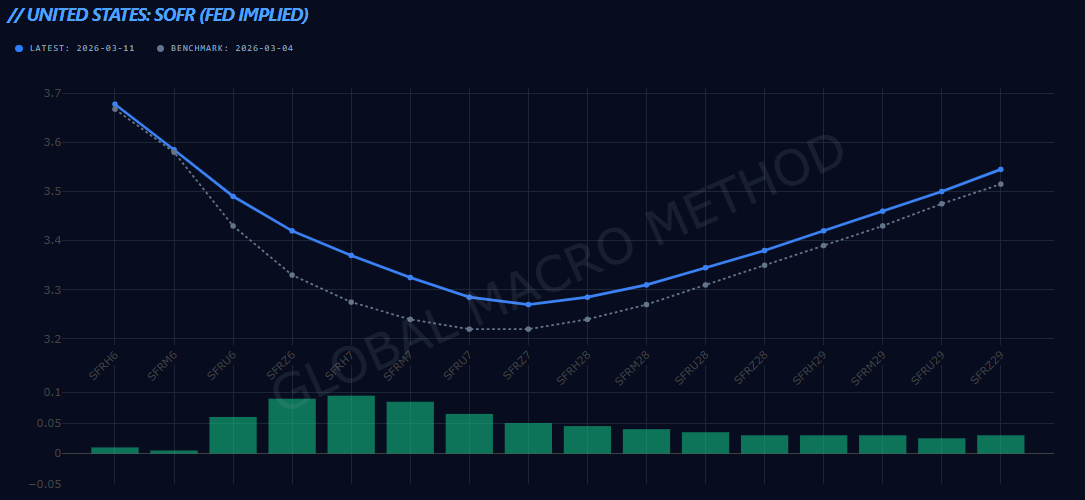
That is why this series is not really about learning a few bits of rates jargon. It is about learning how to read the policy path as a macro object.
The basic units of analysis are simple enough. Where is current policy? Where is the market pricing policy to be after the next meeting, the next few meetings, and over the next year? How far is the implied path from current settings? How much of the expected adjustment is near term, and how much is deferred? Is the curve telling you the central bank is expected to move smoothly, reluctantly, abruptly, or not at all?
But if you want to do that properly, you also need to know what the contracts are actually representing. You need to know that quarterly SOFR contracts are not just labelled calendar guesses. You need to know why IMM dates matter. You need to know why an average over a reference quarter is not the same thing as a point-in-time policy level. And you need to know that basis is not a nuisance detail for rates nerds in the back room. It sits right in the middle of whether your interpretation is grounded or superficial.
Another mistake I see all the time is the tendency to focus on the final destination while ignoring the path taken to get there. But in macro, the path often matters as much as the destination. Two different policy paths can land in roughly the same place twelve months from now while implying radically different things for asset markets in the meantime.
A front end that prices delayed easing followed by catch-up cuts is not the same as one that prices a gentle quarterly normalisation cycle. The former may imply inflation persistence first and damage later. The latter may imply a more orderly return toward neutral as disinflation progresses. Equity leadership, FX response, curve shape, and cross-asset volatility can all look very different depending on which path is being priced, even if the total basis points of easing look similar on a year-end tally.
That is another reason the phrase “cuts priced” is too blunt. It hides path dependency. It hides sequencing. And in markets, sequencing is often where the real information sits.
So when I look at the front end, I am not really starting with the question, “How many cuts are in?” I am starting with something more like this: what kind of problem does the market think the central bank is facing, and how quickly does it think that problem forces a change in policy?
That is a much more useful framing device. Because once you ask that question, the front end becomes something much richer than a rate tally. It becomes a live read on whether the market sees inflation as the dominant constraint, growth as the dominant risk, or policy credibility as the dominant uncertainty. It becomes a window into whether the market is leaning toward smooth adjustment, delayed adjustment, or forced adjustment.
And that is really the point of this installment. Before you can interpret front-end moves properly, you have to stop treating the front end as a simple scoreboard. It is not there merely to tell you whether traders are feeling more dovish or more hawkish than yesterday. It is there to show you how the market is mapping the probable path of policy under evolving macro conditions. But to read that map properly, you also need to understand the instruments themselves. Otherwise you are not really reading the curve. You are reading a simplified story laid over the top of it.
That does not mean the market is always right. Of course it is not. But “right” is not the right standard anyway. Useful is the right standard. And when you read it properly, the front end is extremely useful.
In the next installment, I want to take that foundation and move to the more interesting question: when the front end reprices, what is it actually telling you? Because not all front-end selloffs mean the same thing, not all rallies are growth scares, and not all pricing out of cuts should be interpreted as a vote of confidence in the economy. Sometimes the market is pricing stronger growth. Sometimes it is pricing sticky inflation. Sometimes it is pricing a central bank that cannot move when it would like to. Those distinctions matter, and they matter a great deal.
For now, the key idea is simple. Once you stop asking, “How many cuts are priced?” and start asking, “What kind of path is being priced, through what contract structure, on what timetable, and in response to what macro pressure?” you are already a long way closer to reading the front end like a practitioner rather than a headline consumer.
A proper banger sir
If I take the assumption that Powell is political and fashionable late. And I take the assumption the fed is bad at their job (data dorks) then they will not cut this week due to the immediate affects of inflation shock we are experiencing due to oil?
What odds do you give a cut this week ?
Thank you very much. Very informative, very useful, keep it coming, please!